
Digital transformation is moving fast, and with it, user expectations are getting higher every year. In 2026, people expect apps to load instantly, respond smoothly, and work flawlessly, whether they’re using a website, a mobile app, or an API in the background. That’s exactly why performance testing has become such a big deal. In fact, the global performance testing tools market is projected to grow from $980 million in 2025 to $1.304 billion by 2031, showing a steady 4.9% growth rate. Simply put, businesses are investing more than ever in tools that help them deliver great user experiences.
Performance testing isn’t just about throwing traffic at an app and hoping for the best. It includes load testing, stress testing, and scalability testing, all of which help teams understand how their applications behave under real-world conditions. These tests reveal hidden bottlenecks, highlight resource issues, and make sure applications can handle growth, peak traffic, and unexpected spikes without slowing down or crashing.
In this blog, we’ll walk through the best 11 performance testing tools for 2026, breaking down what makes each one useful in today’s development landscape. From real-device testing and cloud-based load simulation to CI/CD pipeline integration, API performance validation, and end-to-end automation, these tools help development and QA teams choose the right fit for their workflow. The goal is simple: build applications that are fast, reliable, and ready for real users, every single time.
Before choosing a performance testing tool, it’s important to understand the difference between load and stress testing, as each approach evaluates application behavior under very different conditions.
List of the Best 11 Performance Testing Tools
Here’s a curated list of the best performance testing tools in 2026, covering load, stress, and scalability testing, real-device execution, API monitoring, and cloud simulations to help teams ensure fast, reliable, and scalable applications.
1. Apache JMeter – Most Trusted Open-Source Load Testing Tool
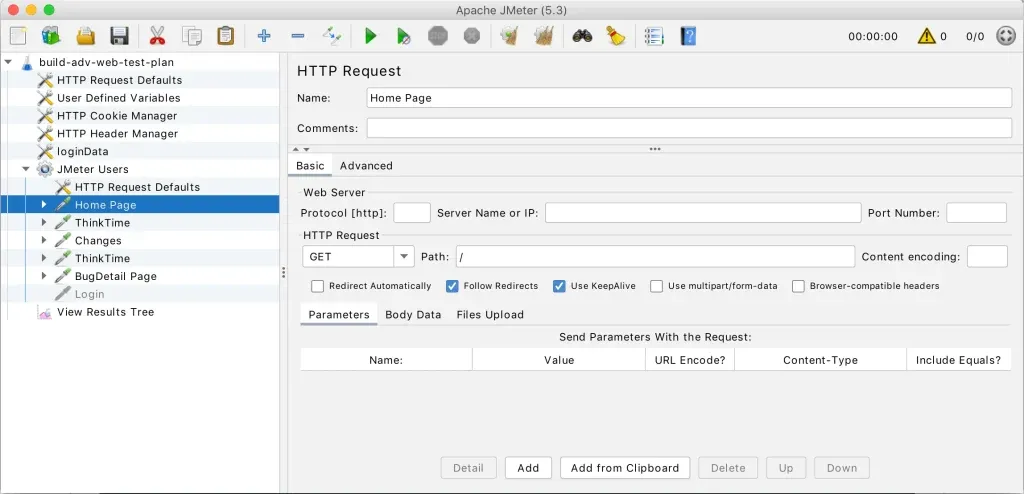
Apache JMeter continues to be a go-to tool in 2026 for teams that value control, flexibility, and open-source freedom. It’s widely used for load testing web applications, APIs, databases, and servers.
JMeter relies on simulated users, not real browsers, which makes it better suited for backend and protocol-level testing rather than front-end performance.
Why teams still use JMeter
- Completely free and open source
- Huge plugin ecosystem
- Strong community support
- Highly customizable test plans
Pricing
Free
Other factors to consider
- Requires scripting and technical expertise
- Setup and maintenance can be time-consuming
- No real-browser simulation
Best for
Developers and QA engineers who want a powerful, no-cost backend performance testing tool.
2. k6 – Best for API and Microservices Performance Testing
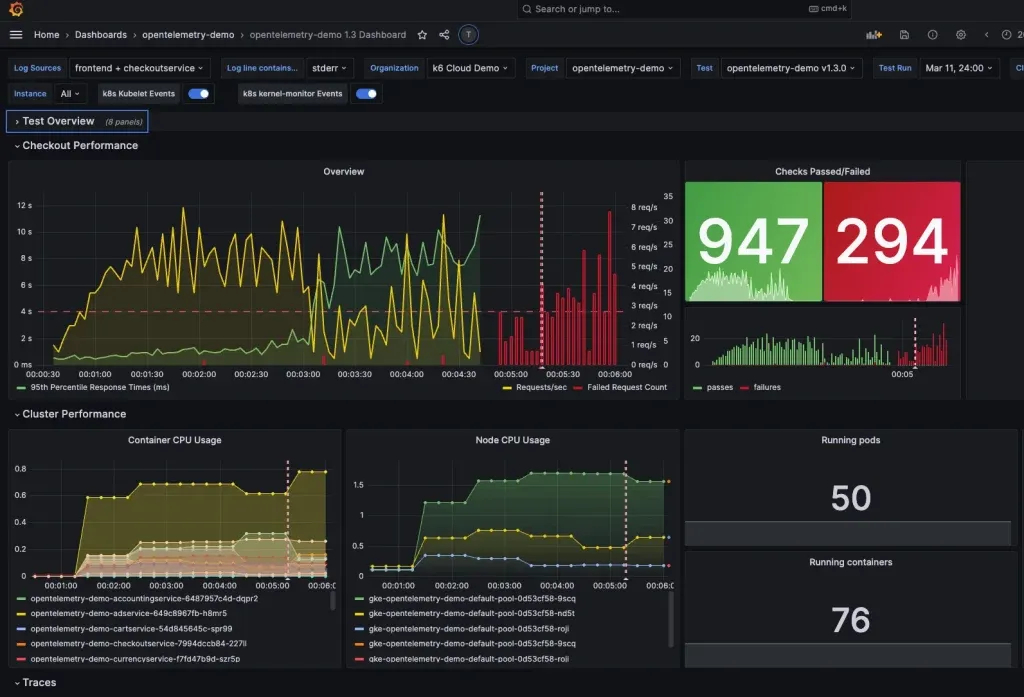
k6 has earned its popularity among DevOps teams thanks to its modern, code-first approach. Written in JavaScript, it fits naturally into CI/CD pipelines and cloud-native environments.
It shines when testing APIs, microservices, and Kubernetes-based systems, and it integrates smoothly with observability tools.
Why k6 stands out
- JavaScript-based scripting
- Built for automation and CI/CD
- Strong observability integrations
- Lightweight and fast execution
Pricing
- Free open-source version
- Paid cloud plans start at around $19 per month
Other factors to consider
- Limited real-browser testing
- Best suited for technical teams
- Strong focus on backend performance
Best for
Engineering teams focused on API reliability and cloud-native systems.
3. LoadNinja – Best No-Code Real Browser Load Testing
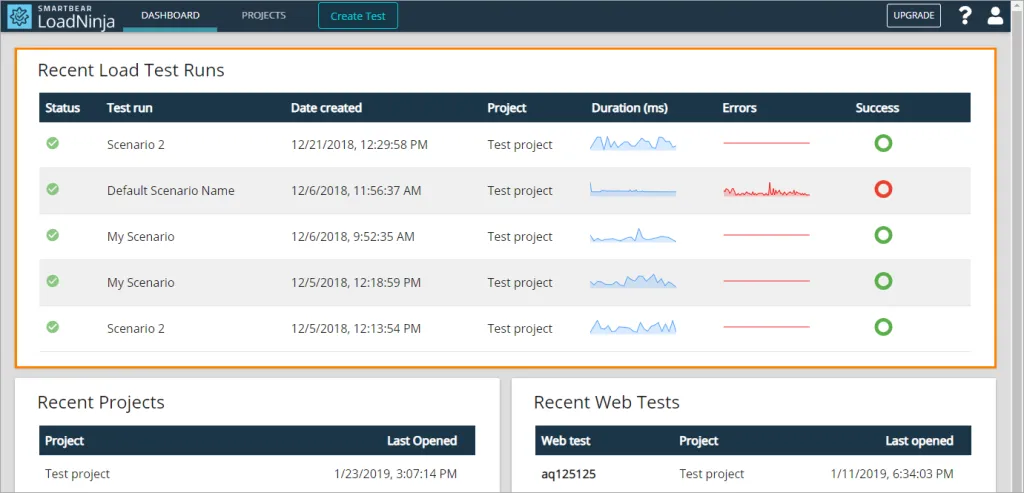
LoadNinja is a great option for teams that want real browser testing without writing scripts. Instead of simulating traffic, it uses real browsers, making UI performance insights far more accurate.
Its recorder lets users create tests simply by interacting with the application.
Why LoadNinja is popular
- Real browser-based load testing
- No coding required
- Simple test recording
- Clear UI and performance metrics
Pricing
- Starts at around $350 for limited testing hours
- Enterprise pricing available
Other factors to consider
- Cost can increase with higher usage
- Focused mainly on web applications
Best fo
QA and product teams focused on front-end performance and user experience.
4. LoadRunner – Best Enterprise-Grade Performance Testing Tool
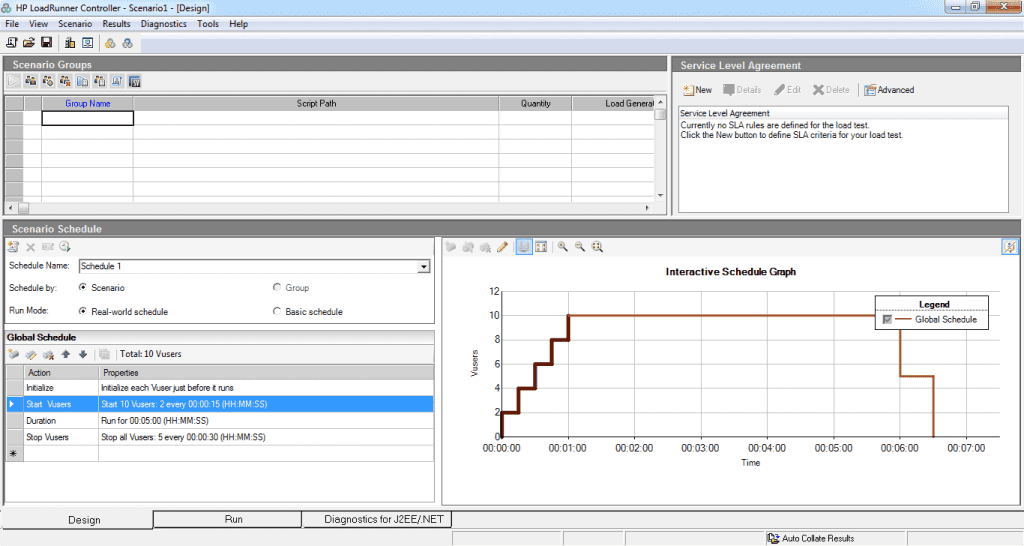
LoadRunner is one of the most established performance testing tools in the industry and remains highly relevant in 2026, especially for large enterprises and complex systems. Now part of OpenText, LoadRunner supports performance testing across web, mobile, APIs, enterprise applications, and legacy systems.
It is well known for its ability to simulate very high user loads and provide deep insights into system behavior across application tiers. LoadRunner is often used in regulated industries where reliability, accuracy, and detailed reporting are critical.
Why enterprises still choose LoadRunner
- Supports a wide range of protocols and technologies
- Scales to thousands or millions of virtual users
- Strong correlation and parameterization capabilities
- Detailed performance analysis and reporting
- Proven reliability for mission-critical systems
Pricing
- Enterprise-focused
- Custom pricing based on virtual users and usage
Other factors to consider
- Higher cost compared to modern open-source tools
- Requires training and expertise to use effectively
- Best suited for complex, large-scale environments
Best for
Large organizations that need robust, enterprise-grade performance testing for complex, high-risk applications.
5. Tricentis NeoLoad – Best for CI/CD-Driven Performance Testing
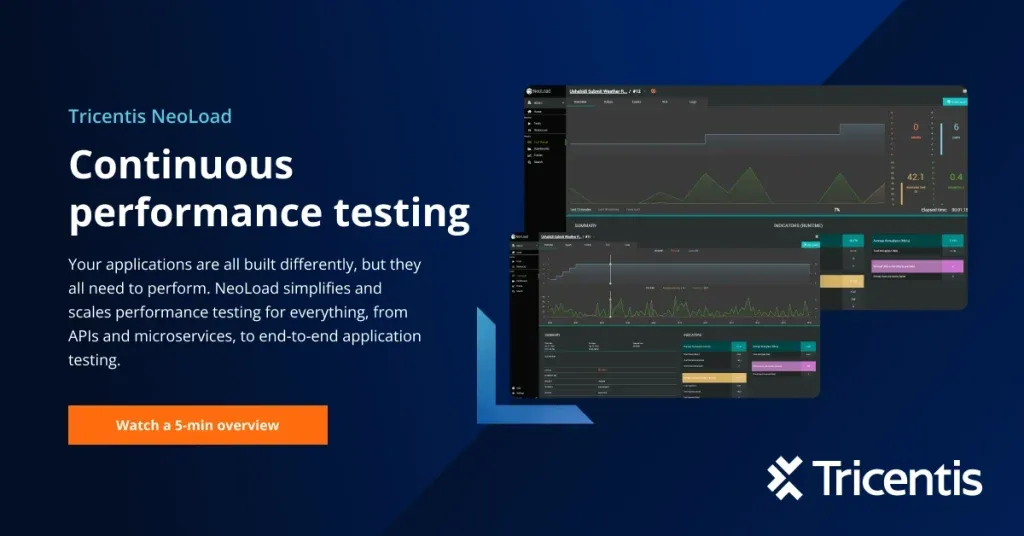
NeoLoad is built for Agile and DevOps teams that release frequently. It supports low-code and no-code test creation and integrates smoothly into CI/CD pipelines.
It also works well with existing JMeter and Gatling scripts, which helps teams transition easily.
Why teams use NeoLoad
- Low-code test design
- Strong CI/CD integration
- Enterprise-grade reporting
- Supports APIs, web, and mobile
Pricing
- Enterprise-focused
- Custom pricing via sales
Other factors to consider
- Higher cost compared to open-source tools
- Best suited for larger teams
Best for
Teams running frequent releases and automated pipelines.
6. Gatling – Best Developer-Centric Load Testing Tool
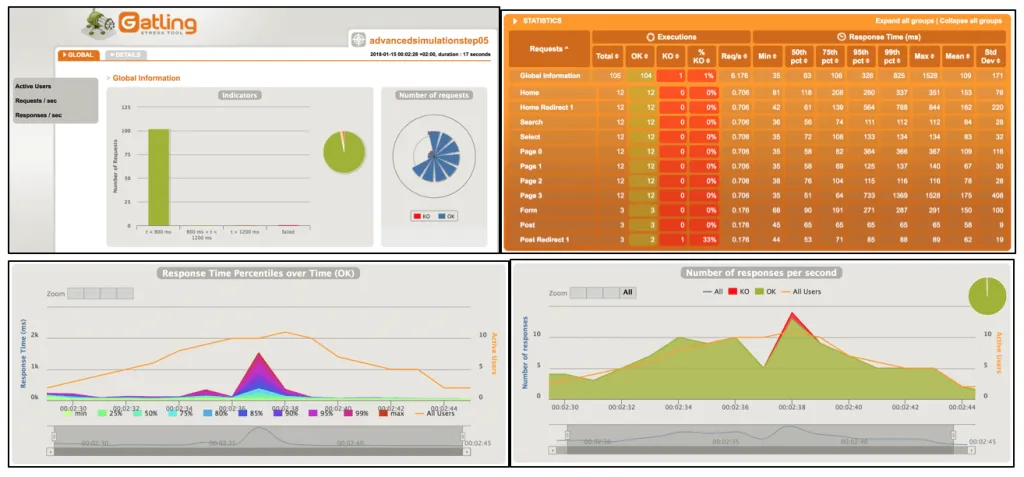
Gatling is designed for developers who prefer code-driven performance testing. It offers high performance, efficient resource usage, and detailed HTML reports.
Why developers prefer Gatling
- High-speed execution engine
- Expressive scripting
- CI/CD and cloud support
- Excellent reporting
Pricing
- Free open-source version
- Paid plans start at around $100 per month
Other factors to consider
- Requires coding knowledge
- Limited real-browser testing
Best for
Developer-led performance testing in DevOps environments.
7. BlazeMeter – Best Cloud-Scale Load Testing
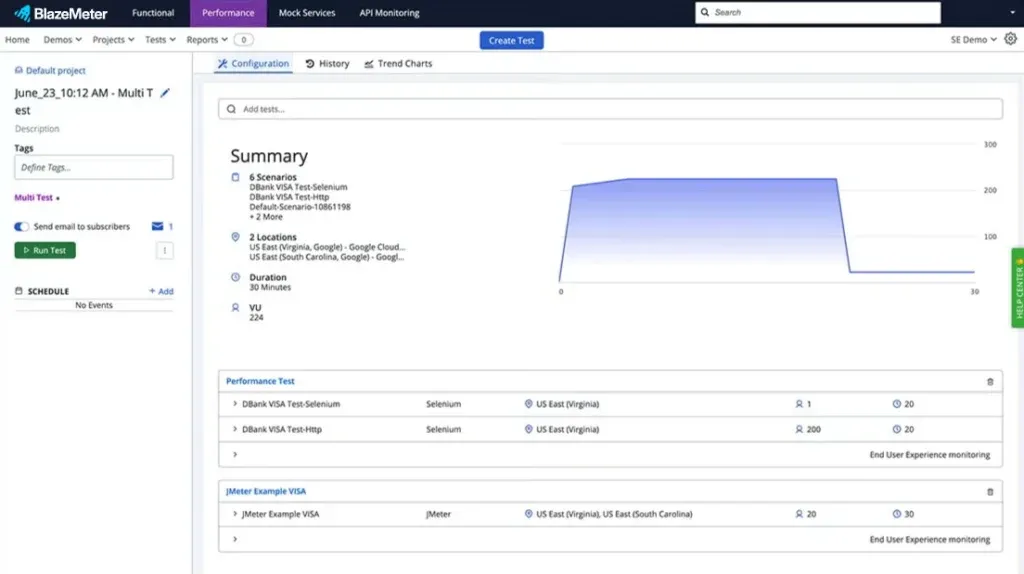
BlazeMeter is known for running massive, distributed load tests without infrastructure headaches. It’s fully compatible with JMeter and ideal for enterprise-scale testing.
Why BlazeMeter works well
- High scalability
- Cloud-native execution
- JMeter compatibility
- Enterprise support
Pricing
- Starts at around $149 per month
- Custom enterprise plans available
Other factors to consider
- Cost increases with load volume
- Simulated users only
Best for
Teams needing large-scale, distributed load testing.
9. LoadView – Best for Real-World Browser Simulation
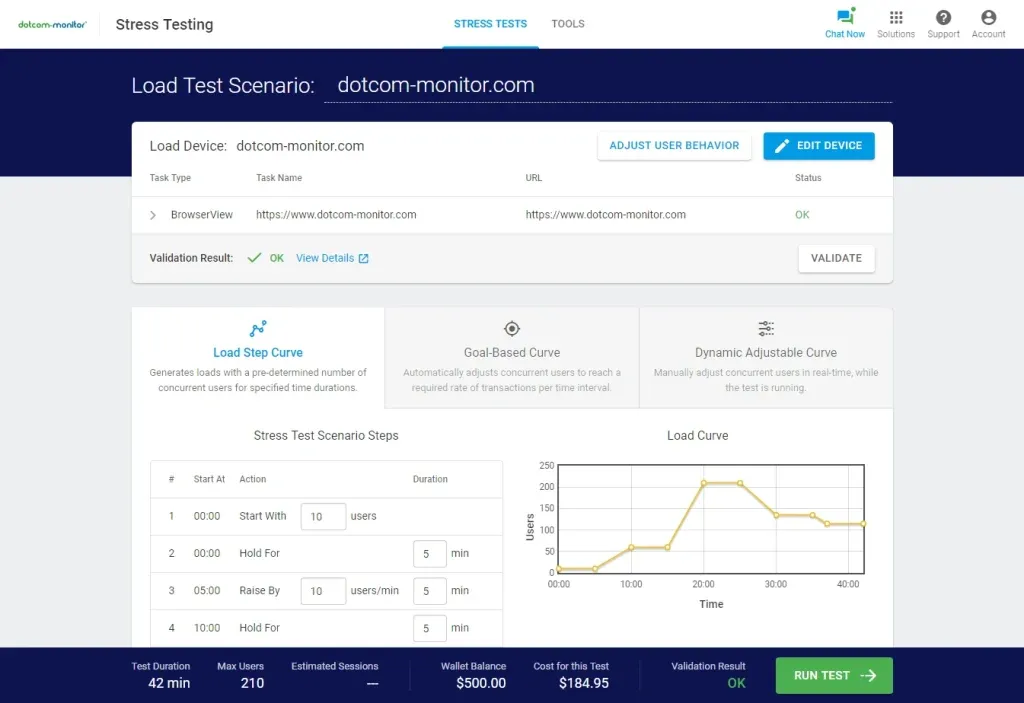
LoadView focuses on realism by using real browsers from multiple geographic locations. This helps teams understand how global users experience their applications.
Why LoadView is useful
- Real browser testing
- Global traffic simulation
- Accurate front-end metrics
Pricing
- Pay-as-you-go model
- Pricing depends on test duration and load
Other factors to consider
- Cost varies with usage
- Primarily web-focused
Best for
Teams testing customer-facing web applications worldwide.
10. New Relic – Best for Real-Time Performance Visibility and Insights
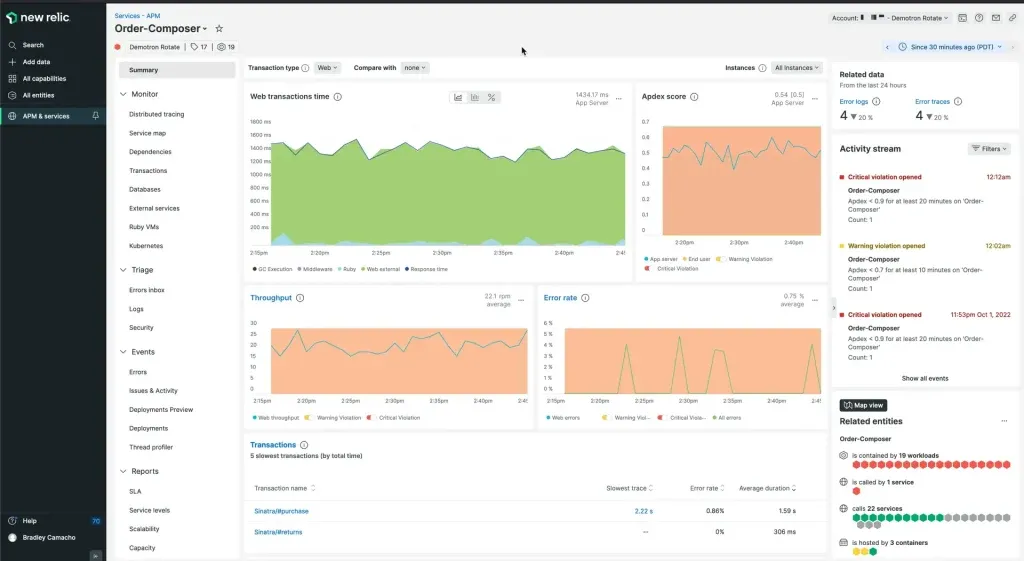
New Relic is a powerful observability and performance monitoring platform that many teams use alongside their performance testing tools. While it’s not a traditional load-testing tool, it plays a critical role in understanding how applications behave before, during, and after performance tests.
New Relic is especially useful when you want to validate whether performance improvements actually work in real-world conditions.
Why teams rely on New Relic
- Deep application performance monitoring
- Real-time visibility into errors, latency, and throughput
- End-user experience tracking
- Powerful dashboards and alerts
- Works well alongside load and stress testing tools
Pricing
- Free tier available for small teams
- Usage-based pricing for paid plans
- Costs scale based on data ingestion and usage
Other factors to consider
- Focused more on monitoring than load generation
- Pricing can grow with high data volumes
- Excellent complement to tools like TestGrid, k6, or JMeter
Best for
Teams that want continuous performance insights, faster root-cause analysis, and visibility into real user experience, especially in production environments.
11. Baseline11 – Best for Performance Engineering and Benchmarking
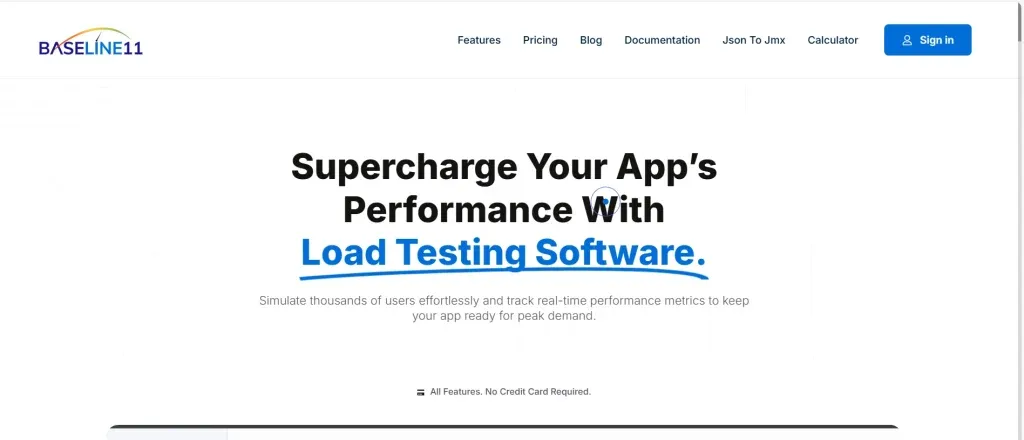
Baseline11 takes a slightly different but very valuable approach to performance testing. Instead of focusing only on load generation, it helps teams define, track, and compare performance baselines across releases. This makes it easier to understand whether application performance is improving or degrading over time.
In modern DevOps environments, where changes are frequent, Baseline11 helps teams turn raw performance data into meaningful benchmarks. It integrates well with existing performance testing and observability tools, making it a strong addition to a performance engineering workflow.
Why teams use Baseline11
- Establishes clear performance baselines
- Compares performance across builds and releases
- Supports data-driven performance decisions
- Complements load testing and APM tools
- Encourages performance engineering best practices
Pricing
- Enterprise-focused platform
- Custom pricing based on usage and integrations
Other factors to consider
- Does not generate load on its own
- Best used alongside tools like JMeter, k6, Dynatrace, or New Relic
- Ideal for mature teams tracking long-term performance trends
Best for
Teams focused on performance engineering, benchmarking, and continuous performance improvement, rather than one-off load tests.
Not Sure Which Performance Testing Tool Fits Your Application?
Every application is different. Our performance testing specialists help you select the right tools, design realistic test scenarios, and validate performance across web, mobile, and API systems, before issues reach production.
Talk to Performance Engineering Experts
Modern Performance Testing Trends in 2026
Performance testing in 2026 looks very different from what it used to be. It’s no longer just about pushing traffic to see when an application breaks. Today, the focus is on smart, automated, and continuous testing that fits naturally into modern DevOps workflows and observability platforms.
One of the biggest shifts is AI-assisted test generation. Tools like TestGrid and Artillery now use AI to automatically create, optimize, and maintain performance test scenarios. This significantly reduces manual scripting and allows teams to move faster without sacrificing coverage.
Another major trend is shift-left performance testing. Instead of waiting until the end of development, teams are validating performance early in the CI/CD pipeline. Catching bottlenecks during development, not after release saves time, cost, and a lot of frustration.
We’re also seeing strong growth in observability-driven testing. Platforms such as Dynatrace, New Relic, and k6 integrate directly with tools like Grafana, Prometheus, and Datadog. This gives teams a single, unified view of performance, reliability, and system health across environments.
User experience has also taken center stage. Modern tools now track Core Web Vitals and real user behavior through RUM (Real User Monitoring). This means teams can measure what real users experience, not just what synthetic tests report.
This shift clearly signals the future of performance testing, where AI-driven automation, observability, and resilience testing work together to ensure applications remain reliable at scale.
Finally, performance testing is expanding into resilience and chaos testing. By intentionally injecting latency, failures, or errors, teams can validate how well distributed systems recover under stress. This approach strengthens reliability and prepares applications for real-world disruptions.
Together, these trends show how performance testing has evolved into a continuous reliability practice, blending performance engineering, observability, and AI into one cohesive discipline.
Key Criteria for Choosing Performance Testing Tools
With so many tools available, choosing the right performance testing solution can feel overwhelming. The key is to focus on what actually matters for your application, team, and users.
Here are the most important factors to consider.
Support for Web, Mobile, APIs, and Backend Services
A modern tool should support web applications, native and hybrid mobile apps, APIs, microservices, and cloud-native systems. Support for common protocols like REST, GraphQL, WebSockets, and HTTP is essential. If you work with legacy or packaged applications, that support is a bonus.
Scripting Flexibility and Low-Code Options
Look for tools that support popular languages such as Java, JavaScript, and Python, while also offering low-code or no-code options. AI-assisted scripting can dramatically speed up test creation and reduce ongoing maintenance.
Scalability for Real-World Load
The tool should handle thousands, or even millions, of concurrent users without performance issues. For global applications, support for geographically distributed load testing is critical to accurately simulate real traffic.
CI/CD and Shift-Left Integration
Seamless integration with CI/CD pipelines is no longer optional. The right tool should support automated test execution during builds and deployments, enabling continuous performance validation throughout the development lifecycle.
Advanced Analytics and Reporting
Actionable insights matter more than raw data. Look for real-time dashboards that show response times, error rates, throughput, SLA compliance, Core Web Vitals, and infrastructure health. Clear reporting helps teams quickly identify and prioritize performance issues.
Modern performance testing tools provide rich dashboards, but knowing which performance testing metrics matter most, such as response time, throughput, and error rates, helps teams make better, data-driven decisions.
Network, Device, and User Simulation
Accurate performance testing requires realistic conditions. Tools should simulate network speeds like 3G, 4G, and 5G, device limitations, latency, and geographically distributed users to reflect real-world usage.
Cost, Support, and Deployment Flexibility
Whether you choose an open-source tool or an enterprise platform, make sure it aligns with your budget, scalability needs, support expectations, and deployment options. Always consider the total cost of ownership, not just the sticker price.
Conclusion
Performance testing in 2026 is no longer a last-minute checkpoint, it’s a continuous practice that plays a key role in application reliability and user satisfaction. With rising user expectations and increasingly complex systems, teams must ensure their applications are fast, stable, and scalable at all times.
The tools covered in this blog address different needs, from open-source load testing and API validation to real-browser testing, cloud-scale load generation, and continuous performance monitoring. The right choice depends on your application architecture, team skills, release frequency, and budget.
By selecting the right performance testing tools and adopting modern testing practices, teams can catch issues early, scale with confidence, and deliver smooth, reliable experiences to real users, every time.