
Performance issues rarely come with clear warning signs. One day everything looks fine, and the next day, users complain about slow pages, failed requests, or timeouts, often right after a release or during peak traffic.
That's why performance testing is important. But here's the catch: running performance tests alone doesn't always tell you the full story. You may know something is slow, but not why it's happening or where the real problem lies.
This is where Application Performance Monitoring (APM) quietly steps in, not as a replacement for performance testing but as a powerful support system that helps teams understand what's really going on inside the application during those tests.
What is Application Performance Monitoring?
Application performance monitoring is all about observing how an application behaves while it's running. It keeps an eye on requests flowing through the system, how long they take, where delays occur, and how different components interact with each other.
In the context of performance testing, APM acts like a diagnostic lens. While performance tests apply pressure to the system, APM helps you see how the system reacts internally under that pressure.
Standard APM Tools Commonly Used in Performance Testing
When performance testing is combined with application-level monitoring, teams rely on well-established APM tools to gain visibility into system behavior during test execution. These tools observe how applications respond internally under load, helping teams correlate test results with real performance behavior.
Standard APM tools typically provide capabilities such as transaction tracing, application-level monitoring, dependency analysis, and infrastructure visibility. They are commonly used in test and staging environments alongside performance testing activities to support deeper analysis and faster root cause identification.
Cloud-native monitoring tools, such as AWS CloudWatch and Azure Application Insights for cloud-hosted applications, a choice that often ties back to the broader decision of cloud vs. on-premises testing strategies for 2025.
Some widely adopted APM tools include:
New Relic
Used for full-stack application visibility and transaction tracing
Dynatrace
Known for automated instrumentation and deep system-level insights
AppDynamics
Focuses on business transaction monitoring and application flow analysis
Datadog APM
Popular in cloud-native and microservices-based environments
Elastic APM
Often chosen for flexible and open-source-friendly monitoring setups
Cloud-native monitoring tools
Such as AWS CloudWatch and Azure Application Insights for cloud-hosted applications
Perfmon
Used to monitor server-side resources such as CPU, memory, disk, and network usage during JMeter load tests, helping correlate system resource behavior with performance test results
These APM tools do not replace performance testing. Instead, they complement testing efforts by providing the internal visibility needed to understand why performance changes occur when systems are subjected to load.
Why Performance Testing Needs APM Support
Performance testing tools are excellent at simulating user traffic and measuring how an application responds from the client's perspective. They help answer questions such as:
- Can the system handle the expected load?
- How does response time change as traffic increases?
- Where does the application break under stress?
However, performance testing tools alone offer limited insight into internal application behavior. They can show that a request is slow, but not why.
APM fills this gap by instrumenting the application itself. When performance tests are executed with APM enabled, teams gain visibility into how requests are processed internally, making it easier to diagnose the root causes of performance issues rather than relying on assumptions.
Many production incidents occur during traffic spikes, which is why avoiding app failures during peak usage requires both proactive load testing and deep application monitoring.
Where does the application break under stress? Questions best answered by pairing APM with the right toolset, which is why it helps to review our list of best performance engineering tools available today
APM and Performance Testing: Understanding What's Really Happening Inside Your Application
Performance issues rarely come with clear warning signs. One day everything looks fine, and the next day, users complain about slow pages, failed requests, or timeouts, often right after a release or during peak traffic.
That's why performance testing is important. But here's the catch: running performance tests alone doesn't always tell you the full story. You may know something is slow, but not why it's happening or where the real problem lies.
This is where Application Performance Monitoring (APM) quietly steps in, not as a replacement for performance testing, but as a powerful support system that helps teams understand what's really going on inside the application during those tests.
How You Use APM During Performance Testing
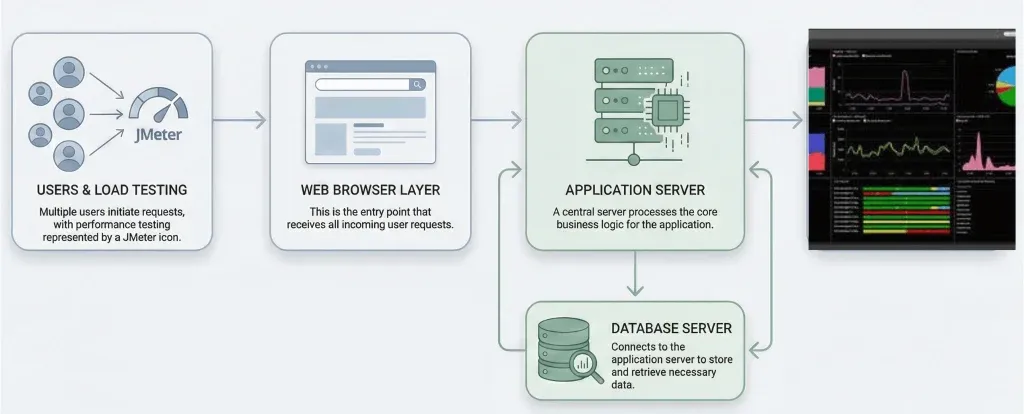
In practice, APM is enabled in test or staging environments while performance tests are running. As load is applied, APM continuously observes how the application reacts internally.
This combined approach allows teams to:
- Correlate external test results with internal system behavior
- Observe how different components respond under increasing load
- Detect performance degradation patterns early in the test cycle
Instead of analyzing test reports in isolation, teams can see a complete performance picture as the test unfolds.
Identifying Bottlenecks with Distributed Tracing
One of the most impactful APM capabilities during performance testing is distributed tracing. Distributed tracing follows each request as it moves through various services, databases, and external systems.
During high-load tests, this makes it possible to:
- Identify slow service-to-service communication
- Detect inefficient database interactions
- Expose hidden dependencies that impact performance
Rather than guessing where delays occur, teams can trace the exact execution path and pinpoint bottlenecks with precision.
In modern architectures, testing distributed systems at scale requires both performance testing and APM-based distributed tracing to accurately identify service-level bottlenecks.
Gaining Insight from Real-Time Performance Behavior
As performance tests run, APM provides continuous insight into how the system behaves internally. This real-time visibility helps teams distinguish between different types of performance issues, for example, whether slow responses are caused by application logic, infrastructure limits, or backend dependencies.
This level of insight significantly reduces troubleshooting time and prevents misdirected optimization efforts.
Baseline Comparison and Performance Trends
Another advantage of using APM in performance testing is access to historical performance data. By comparing current test results with established baselines, teams can:
- Detect performance regressions early
- Validate that recent changes have not degraded system behavior
- Understand long-term performance trends across releases
Over time, this comparison helps organizations move toward more predictable and stable performance outcomes.
APM platforms help teams continuously track key performance testing metrics, making it easier to compare results across test cycles and releases.
Code-Level Visibility During Performance Tests
Advanced APM platforms provide visibility down to the code level, highlighting methods or functions that consume excessive time or resources. During performance testing, this granularity is especially valuable.
Instead of identifying a slow endpoint and stopping there, teams can:
- Locate inefficient logic paths
- Detect poorly optimized queries
- Understand how code behaves as concurrency increases
This accelerates optimization by guiding developers directly to the areas that matter most.
Supporting Continuous Performance Validation
As organizations adopt continuous delivery practices, performance testing is no longer a one-time activity. APM supports this shift by enabling continuous performance validation throughout the development lifecycle.
By observing application behavior during repeated test cycles, teams can identify performance risks earlier and reduce the likelihood of production issues. This approach helps embed performance awareness into everyday development rather than treating it as a last-minute concern.
Connecting Performance Tests to Real User Experience
Some APM platforms also provide real-user insights, allowing teams to compare performance test behavior with how applications perform in real-world usage. This comparison helps validate whether test scenarios accurately reflect actual user patterns.
When test conditions align closely with real usage, performance testing becomes far more effective and meaningful.
This comparison helps validate whether test scenarios accurately reflect actual user patterns, including on mobile, where mobile app performance testing using Appium the right way plays a key role in capturing real device behavior.
Final Thoughts
Performance testing tells teams about the load.
The APM explains why it happens and where it happens.
When used together, performance testing and APM transform performance validation from a basic verification task into a continuous optimization practice. This combination enables teams to identify issues earlier, resolve them faster, and confidently release software that performs reliably at scale.
For modern, high-traffic, and distributed applications, APM is no longer optional; it is an essential companion to effective performance testing.