


Performance testing gives you thousands of numbers, but numbers alone don't tell a story. What really matters is how quickly you can turn raw test data into clear, actionable insights.
That's where HTML reports in JMeter come in. Instead of digging through bulky log files, you get clean dashboards, interactive graphs, and easy-to-share performance summaries, all in just a few clicks (or a single command).
In this guide, you'll learn exactly how to generate HTML reports in JMeter, whether you're using the latest JMeter version or an older setup, and whether you prefer GUI or non-GUI mode. Simple steps, no confusion, just results.
Before generating HTML dashboards, make sure you've completed the how-to download and install JMeter on Windows.
What Is an HTML Report in JMeter?
An HTML report is an interactive dashboard generated from a JMeter results file (.jtl). Instead of reviewing thousands of lines of test data, you can visualize performance metrics through graphs and summary reports.
A typical JMeter HTML report includes the following:
- Response time analysis
- Throughput statistics
- Error percentage
- Active threads
- Response time percentiles (90th, 95th, and 99th)
- APDEX (Application Performance Index)
- Transaction summary
- Latency and connection time
These reports simplify performance analysis and make it easier to identify bottlenecks before deploying your application.
Why Use JMeter HTML Reports?
JMeter HTML reports provide several advantages:
- Interactive dashboards with graphical insights
- Easy identification of performance bottlenecks
- Shareable reports for developers and stakeholders
- Better visualization than raw JTL files
- Faster performance analysis
- Suitable for client presentations and test documentation
Prerequisites Before You Generate the HTML Report
Before generating an HTML report, ensure you have:
- Apache JMeter installed (JMeter 5.5 or later)
- Java installed with the JAVA_HOME environment variable configured
- A valid JMeter test plan (.jmx)
- A successfully executed test that generated a JTL results file (.jtl)
- An empty folder where the HTML report will be generated
How to Generate HTML Reports in JMeter
If you're using JMeter 5.6 or higher (recommended), the HTML dashboard feature works out of the box; no extra configuration files or plugins are needed.
There are two ways to generate this report: through the non-GUI (command line) mode, which is the recommended approach for real load tests, and through the GUI mode, which is simpler for quick, exploratory runs. This guide walks through both.
Method 1: Generate HTML Report Using GUI Mode (Recommended)
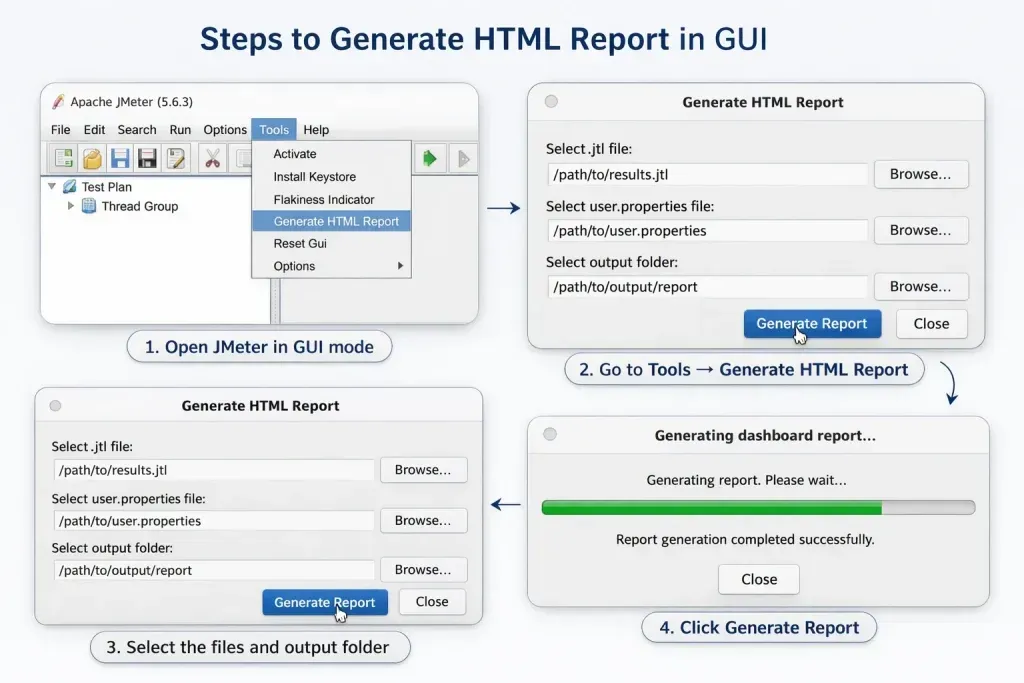
If you're new to Apache JMeter, the GUI method is the easiest way to generate an HTML performance report. This approach is ideal for beginners, small performance tests, proof-of-concept projects, and situations where you want to analyze results manually after executing a test.
The JMeter HTML Dashboard converts your raw JTL results file into an interactive report containing response time graphs, throughput statistics, error percentages, response time percentiles, APDEX scores, and other key performance testing metrics.
Prerequisites
Before generating an HTML report in JMeter, ensure you have:
- Apache JMeter installed (JMeter 5.5 or later)
- Java installed and configured
- A valid JMeter test plan (.jmx)
- A successfully executed test that generated a JTL results file (.jtl)
- An empty output directory where the HTML report will be generated
Step 1: Open Your JMeter Test Plan
Launch Apache JMeter and open the test plan you want to analyze.
- Open Apache JMeter.
- Navigate to File → Open.
- Select your saved JMeter test plan (.jmx).
Example
Updated_Login.jmx
Your test plan is now ready for execution.
Step 2: Configure the JTL Results File
Before running the test, configure where JMeter should save the execution results. The generated JTL file serves as the input for creating the HTML dashboard report.
- Select the Aggregate Report listener or Simple Data Writer.
- Locate the filename field.
- Click Browse.
- Choose the location where the JTL file will be saved.
Example
D:\yourproject\test.jtl
Click Save to confirm the file location.
Tip: Saving the JTL file in a dedicated folder makes it easier to manage multiple performance test executions.
Step 3: Execute the Performance Test
Once the results file has been configured, execute the JMeter test.
- Click the Start (▶) button.
- Wait until the test execution is finished.
- Verify that the test.jtl file has been created successfully at the specified location.
The JTL file contains all the performance metrics collected during the test, including response times, throughput, latency, active threads, and error information.
Step 4: Open the JMeter HTML Report Generator
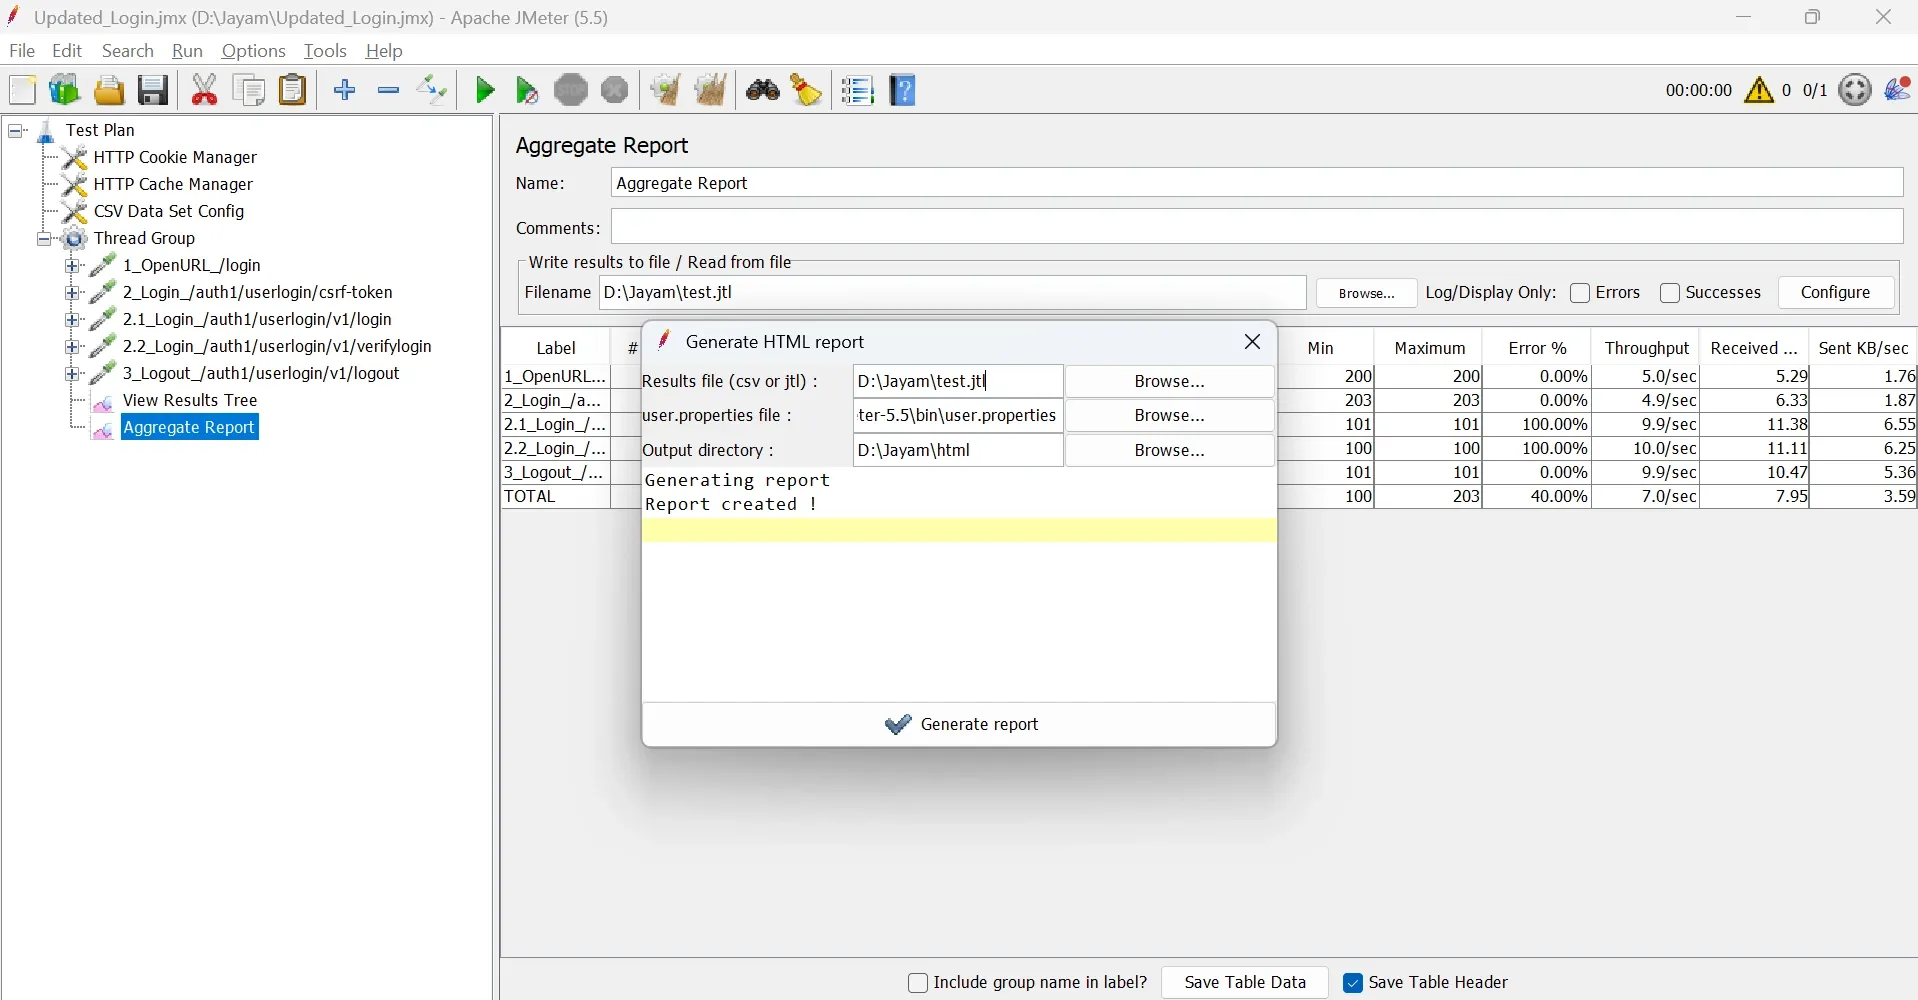
After completing the test execution, open JMeter's built-in HTML Dashboard generator.
From the menu bar, navigate to:
Tools → Generate HTML Report Dashboard
The Generate HTML Report dialog box will appear.
Step 5: Configure the HTML Report Settings
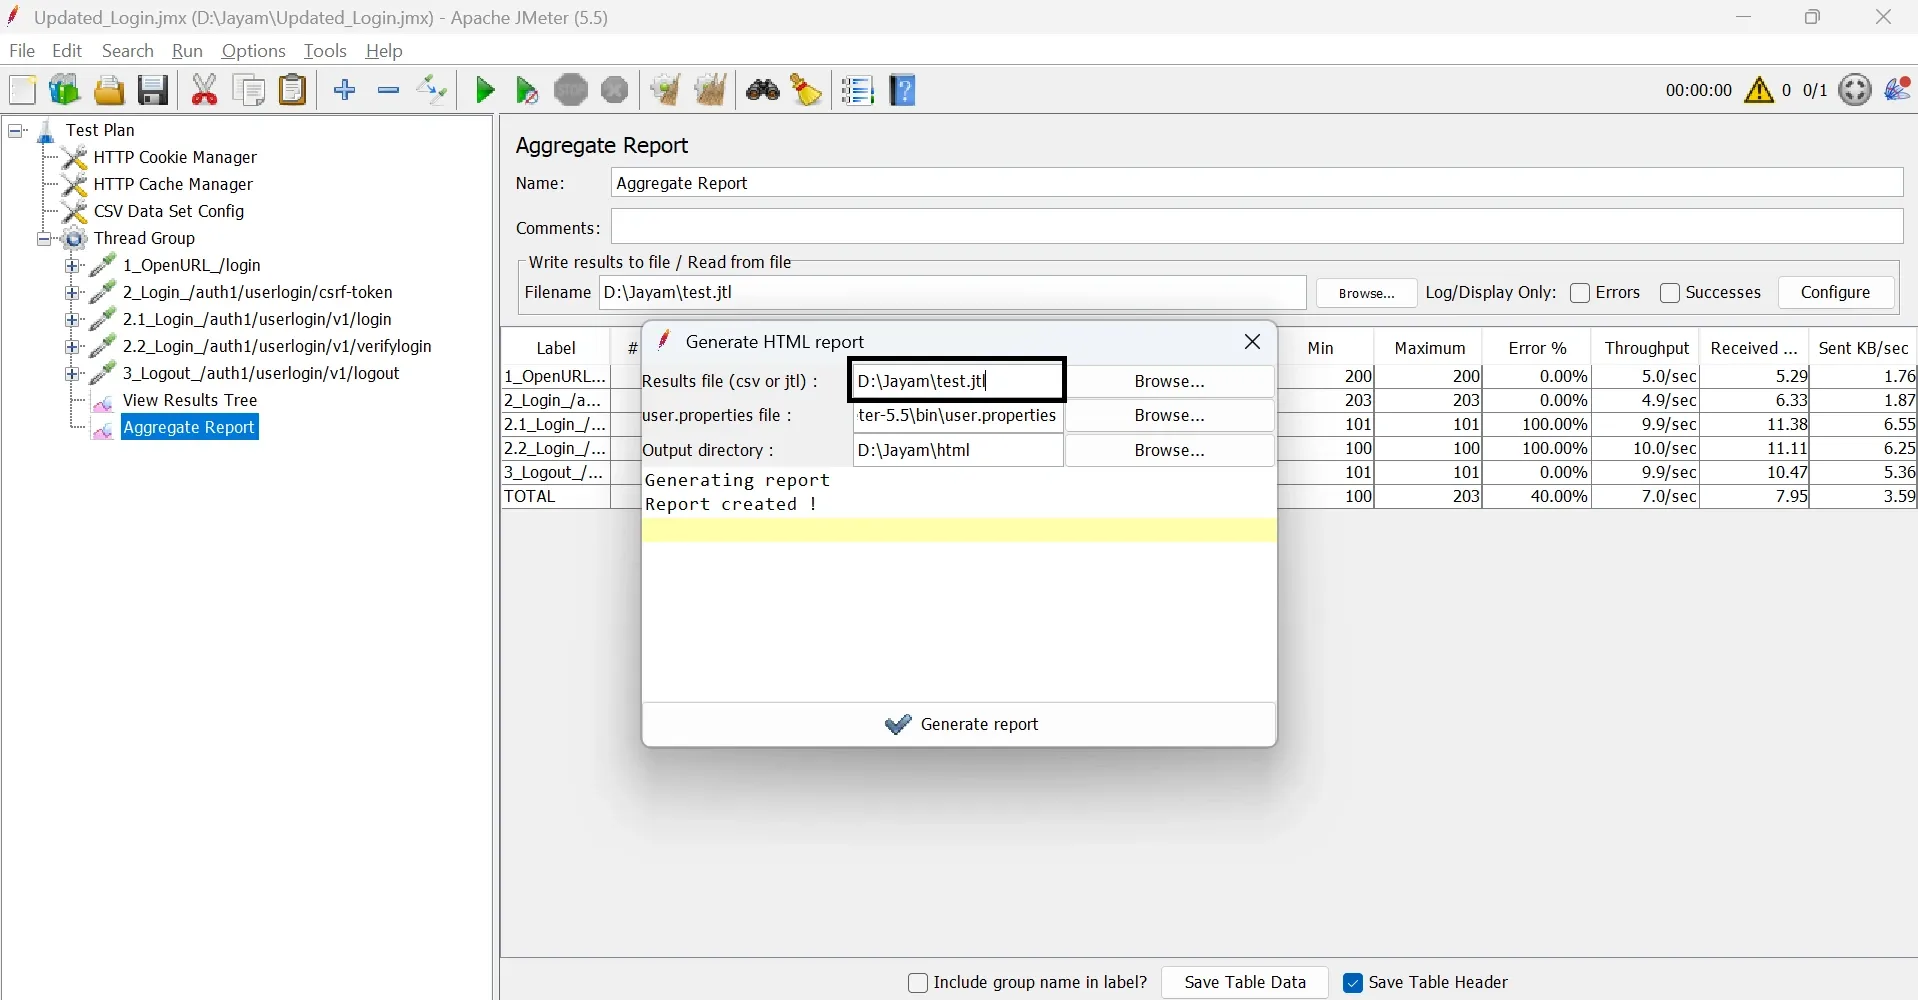
Provide the required information before generating the report.
Results File
Browse and select the generated JTL results file.
Example
D:\yourproject\test.jtl
User Properties File (JMeter 5.5)
If you're using JMeter 5.5 and receive the error:
The specified file doesn't exist.
Browse to your JMeter installation directory and select the user.properties file.
Example
C:\apache-jmeter-5.5\bin\user.properties
If the file is unavailable, you can alternatively select:
C:\apache-jmeter-5.5\bin\jmeter.properties
Note: Recent JMeter versions may not require you to manually select this file unless you've customized report generation settings.
Output Directory
Choose a new or empty folder where the HTML Dashboard Report will be generated.
Example
D:\yourproject\HTML_Report
Important: The output directory must be empty. If it already contains files, JMeter will not generate the report successfully.
Step 6: Generate the HTML Dashboard Report
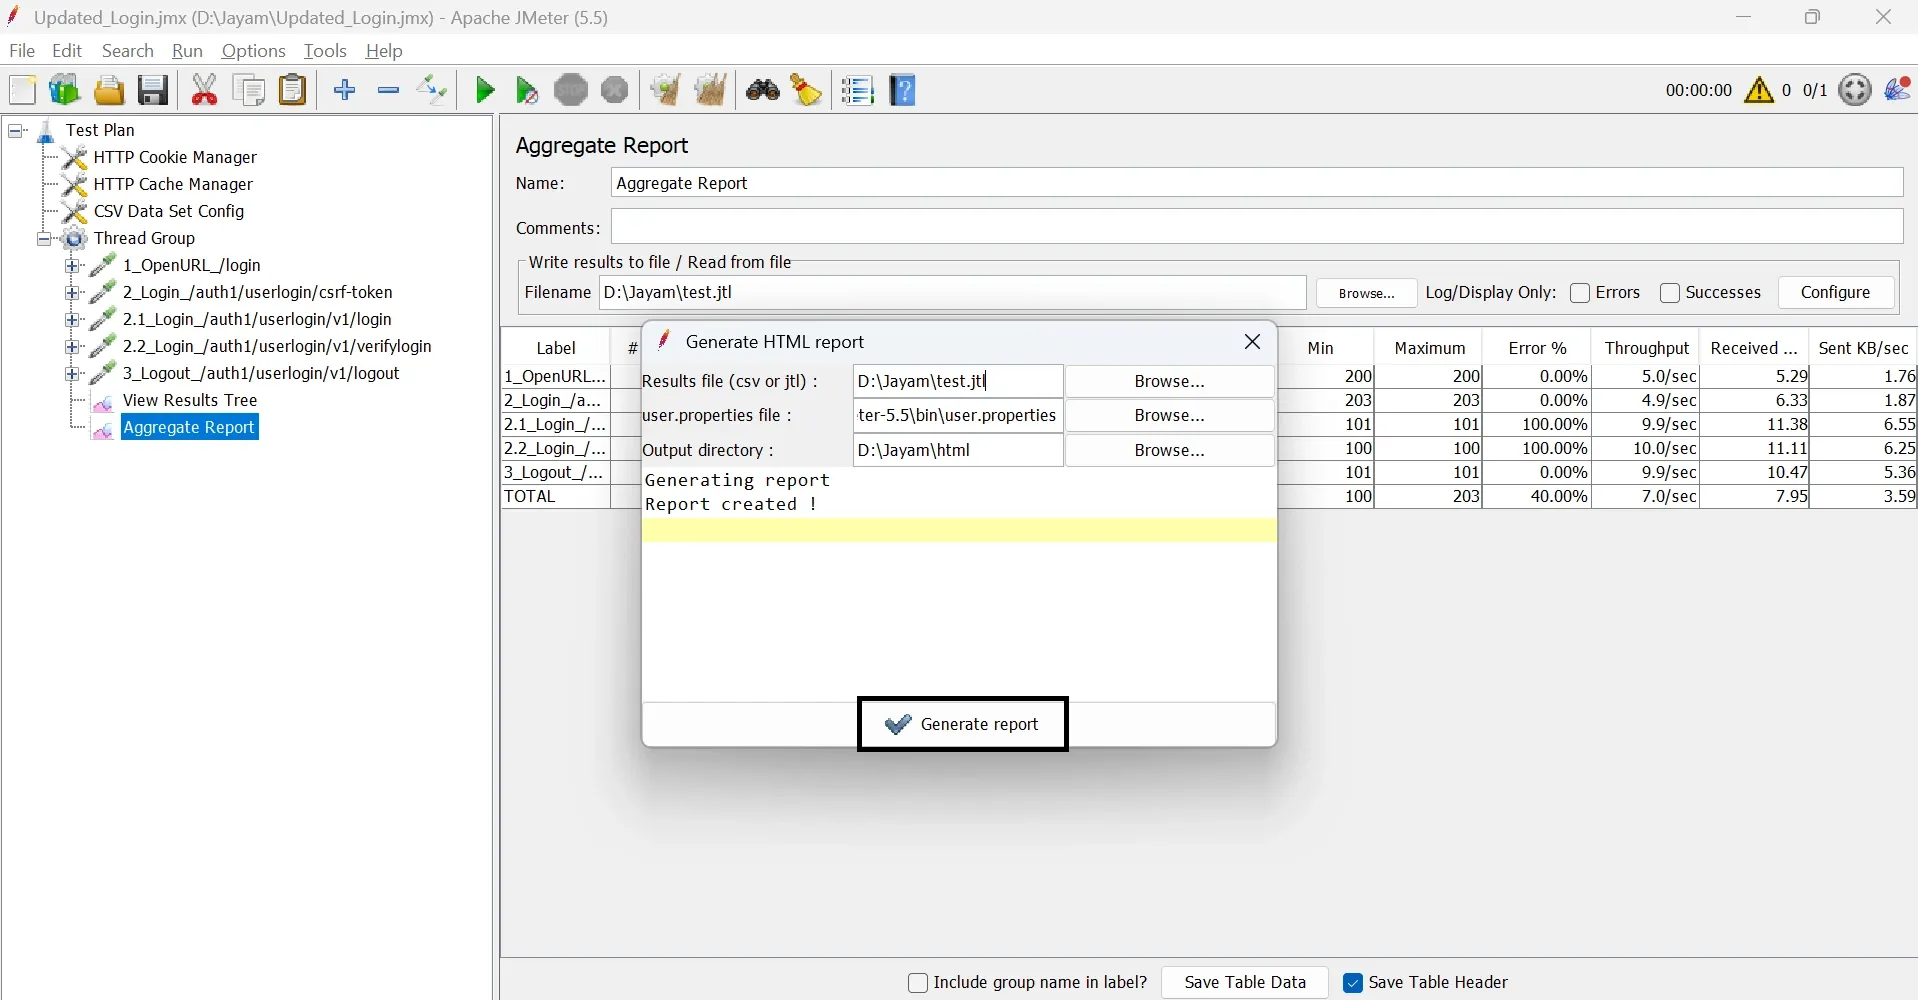
Click Generate Report.
JMeter reads the JTL results file, processes the performance data, and creates an interactive HTML dashboard.
Once the process completes successfully, you'll see a confirmation message similar to:
Generating report...
Dashboard generated successfully.
Depending on the size of your JTL file, report generation may take a few seconds to several minutes.
Step 7: Open the Generated HTML Report
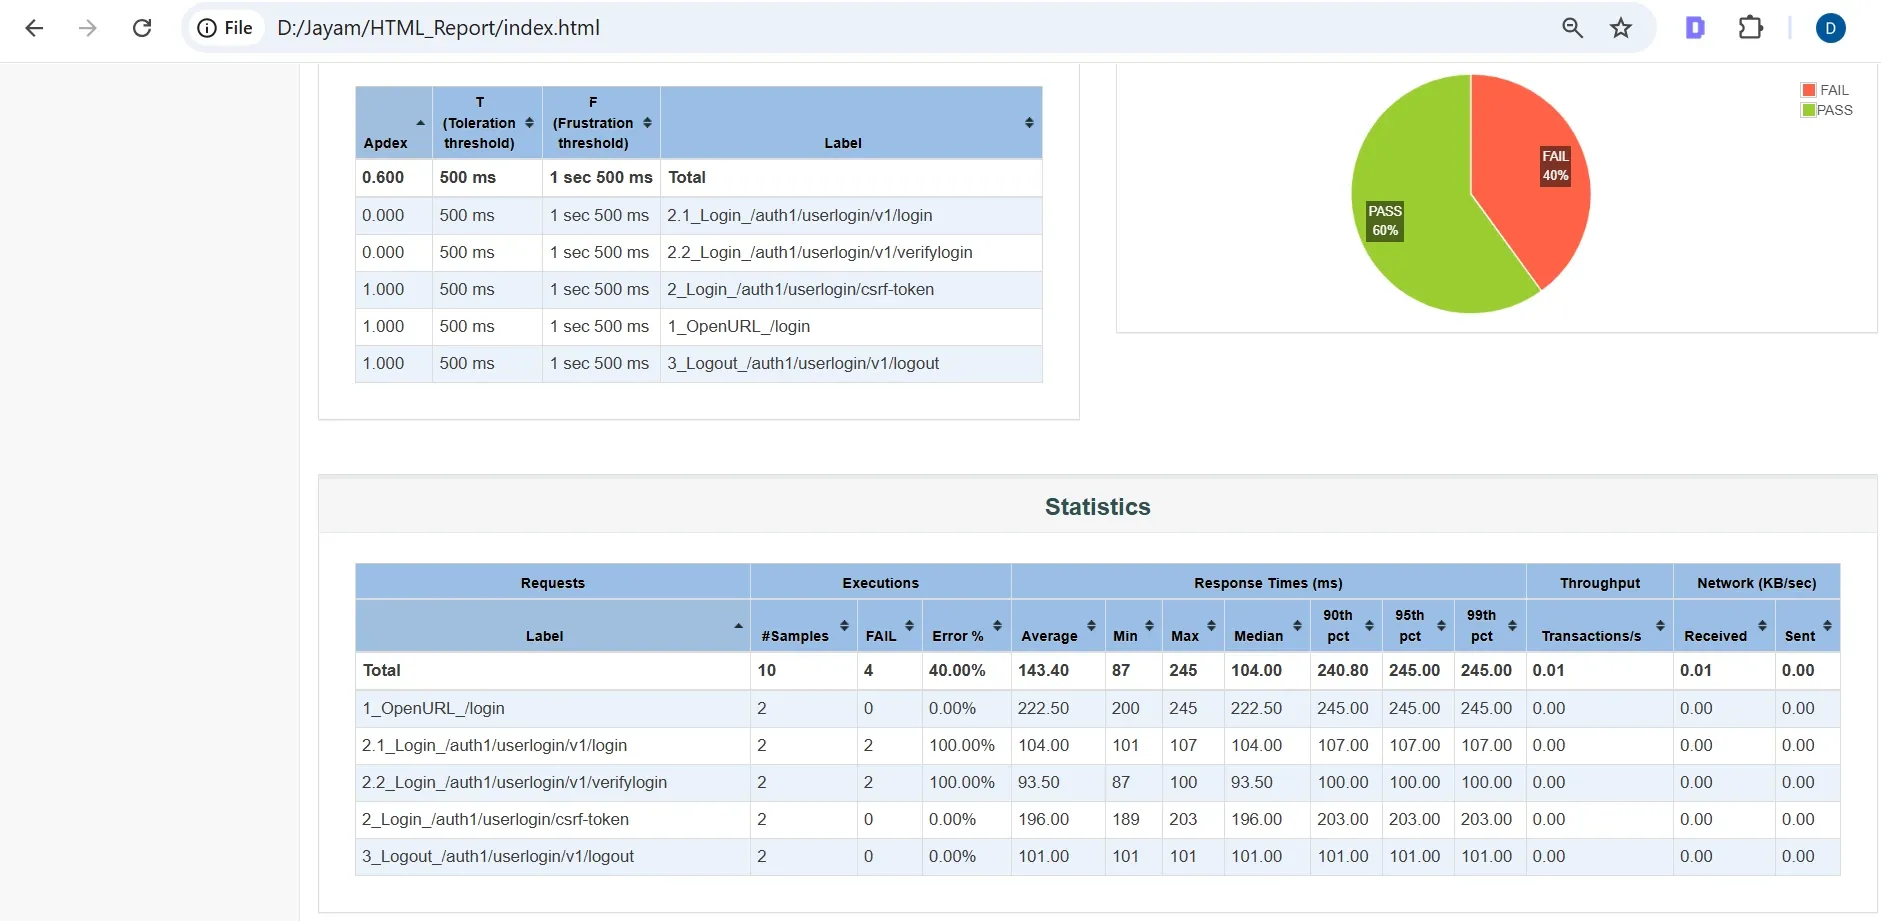
Navigate to the output directory you selected.
Example
D:\yourproject\HTML_Report
Open the following file:
index.html
The JMeter HTML Dashboard will open in your default web browser.
The report includes several interactive charts and performance metrics, such as:
- Response Time Over Time
- Throughput
- Error Rate
- Response Time Percentiles
- APDEX Score
- Active Threads
- Transaction Summary
- Latency Distribution
These visualizations help you quickly identify performance bottlenecks, validate application scalability, and share performance testing results with developers, stakeholders, or clients.
Method 2: Generate HTML Report Using Non-GUI Mode (Manual Option)
For load testing and performance testing, running JMeter in non-GUI mode (command line mode) is the recommended approach. Unlike GUI mode, non-GUI mode executes your test without launching the graphical interface, reducing CPU and memory usage while delivering more reliable performance results.
This method is widely used for large-scale load tests, automated CI/CD pipelines, and cloud-based performance testing because it efficiently handles thousands of virtual users.
In addition to executing the test, you can generate an HTML dashboard report from the resulting JTL file, making it easier to analyze response times, throughput, error rates, and other key performance metrics.
Prerequisites
Before running a JMeter test in Non-GUI mode, ensure that you have:
- Apache JMeter installed
- Java installed and the JAVA_HOME environment variable configured
- A valid JMeter test plan (.jmx)
- Access to Command Prompt (Windows) or Terminal (Linux/macOS)
Step 1: Save Your JMeter Test Plan
Before executing the test from the command line, save your JMeter test plan.
Example:
D:\yourproject\Updated_Login.jmx
The .jmx file contains all your test configurations, including thread groups, samplers, assertions, and listeners.
Step 2: Open Command Prompt
On Windows:
- Press Win + R.
- Type:
cmd
- Click OK.
This opens the Command Prompt, where you'll execute JMeter commands.
Step 3: Navigate to the JMeter Bin Directory
Move to the JMeter bin folder using the cd command.
Example:
cd C:\apache-jmeter-5.5\bin
To verify that you're in the correct directory, run:
dir
You should see files similar to:
- jmeter.bat
- ApacheJMeter.jar
- jmeter.properties
This confirms that you're ready to execute JMeter from the command line.
Step 4: Run the JMeter Test in Non-GUI Mode
Execute the following command:
jmeter -n -t D:\yourproject\Updated_Login.jmx -l D:\yourproject\test.jtl
Command Explanation
| Option | Description |
|---|---|
| -n | Runs JMeter in Non-GUI (Command Line) mode |
| -t | Specifies the path to the JMeter test plan (.jmx) |
| -l | Saves the test execution results to a JTL file |
This command executes your performance test without opening the JMeter interface and stores all test results in the specified JTL file.
Step 5: Verify Test Execution
Once the test completes successfully, the Command Prompt displays messages similar to:
Starting the test...

Waiting for possible Shutdown/StopTestNow/HeapDump...

Tidying up...

End of test
JMeter also generates the following results file:
D:\yourproject\test.jtl
This JTL file contains all performance metrics collected during the test, including response time, throughput, latency, active threads, and error information.
Step 6: Generate the HTML Dashboard Report
After the test execution is complete, generate the HTML report using the JTL file.
Run the following command:
jmeter -g D:\yourproject\test.jtl -o D:\yourproject\HTML_Report
Command Explanation
| Option | Description |
|---|---|
| -g | Reads an existing JTL results file |
| -o | Specifies the output directory for the HTML Dashboard Report |
Important: The output directory must be empty or must not already exist. Otherwise, JMeter will fail to generate the report.
Step 7: View the HTML Report
Navigate to the output directory.
Example:
D:\yourproject\HTML_Report
Open the following file:
index.html
The JMeter HTML Dashboard Report will open in your default web browser.
The dashboard provides detailed performance insights, including:
- Response Time Over Time
- Throughput
- Error Percentage
- Response Time Percentiles
- APDEX Score
- Active Threads
- Transaction Summary
- Latency Distribution
These interactive graphs and performance metrics help you identify bottlenecks, evaluate application scalability, and share performance test results with your development team or stakeholders.
What This Non GUI Command Does
| Flag | Description |
|---|---|
| -n | Runs JMeter in non-GUI mode |
| -t | Path of your JMX test file |
| -l | Location where test results are saved |
| -e | Tells JMeter to generate an HTML report |
| -o | Specifies the output folder for the report |
Conclusion
Generating an HTML report in JMeter is one of the easiest ways to transform raw performance test results into meaningful insights. Whether you choose the GUI method for quick analysis or the non-GUI method for large-scale load testing and CI/CD pipelines, the HTML Dashboard provides a comprehensive view of your application's performance.
The report includes critical metrics such as response time, throughput, error percentage, APDEX score, active threads, and response time percentiles, helping you identify bottlenecks and make informed optimization decisions. For production environments and high-load tests, running JMeter in non-GUI mode is the recommended approach because it consumes fewer system resources and delivers more accurate performance results.
By following the steps outlined in this guide, you can generate professional, interactive HTML reports that simplify performance analysis and make it easier to share results with developers, QA teams, and stakeholders.