


Have you ever wondered how websites like Amazon or Netflix manage to stay lightning-fast even when millions of users are online? That’s where performance testing tools like JMeter come into play.
JMeter is one of the most trusted tools for simulating real-world traffic and testing how an application performs under different loads. Whether you’re a QA engineer, developer, or someone curious about automation testing, understanding JMeter performance testing helps you ensure your app performs efficiently under load
Let’s explore what makes JMeter such a powerful performance testing tool and how you can get started with it.
What Is JMeter?
Apache JMeter is an open-source testing tool built in Java. Originally designed for testing web applications, JMeter has evolved into a multi-purpose tool capable of handling load testing, performance testing, functional testing, and API testing.
In simple terms, JMeter is used to simulate a large number of users hitting your website or application simultaneously. It then monitors how your system behaves under that pressure, helping you find out if your app can handle peak traffic smoothly or if it will slow down or crash.
Some of the automated functions of JMeter include generating heavy load on servers, measuring response time and throughput, simulating concurrent users, and automating performance reports with graphical analysis.
Whether you’re testing a website, API, or database, JMeter test performance helps ensure your app performs well before it reaches real users.
What Is JMeter Used For?
You might be wondering, with so many testing tools available, what JMeter is used for specifically.
JMeter is mainly used to perform load, stress, spike, endurance, API, and functional testing. Load testing helps check how an app behaves with multiple concurrent users. Stress testing pushes the system beyond its capacity to see when it breaks.
Spike testing measures how well the system responds to sudden surges in traffic. Endurance testing checks long-term stability, while API and functional testing ensure every request and feature behaves as expected.
With its user-friendly GUI and command-line flexibility, JMeter supports everything from quick manual runs to large-scale automated pipelines.
Key JMeter Functions You Should Know
JMeter’s strength lies in its wide range of built-in functions that simplify complex testing scenarios. These functions help users control test behavior, reuse values dynamically, and generate real-world data without writing complicated scripts.
For example, Thread Groups define how many virtual users will run and at what speed. Samplers send different types of requests to the server, like HTTP, JDBC, FTP, or SOAP. Listeners gather and visualize results in tables, graphs, or dashboards, verify whether the server responses are correct, while Timers introduce deliberate delays between requests to simulate realistic user pacing. Configuration Elements store data such as URLs, credentials, or tokens that might change between tests.
Together, these functions form the backbone of the automated functions of JMeter, allowing QA teams to build complex load scenarios that closely mirror real-world usage.
You can download a sample JMeter .jmx test plan directly from the official JMeter website at this link:
https://jmeter.apache.org/demos/ForEachTest2.jmx
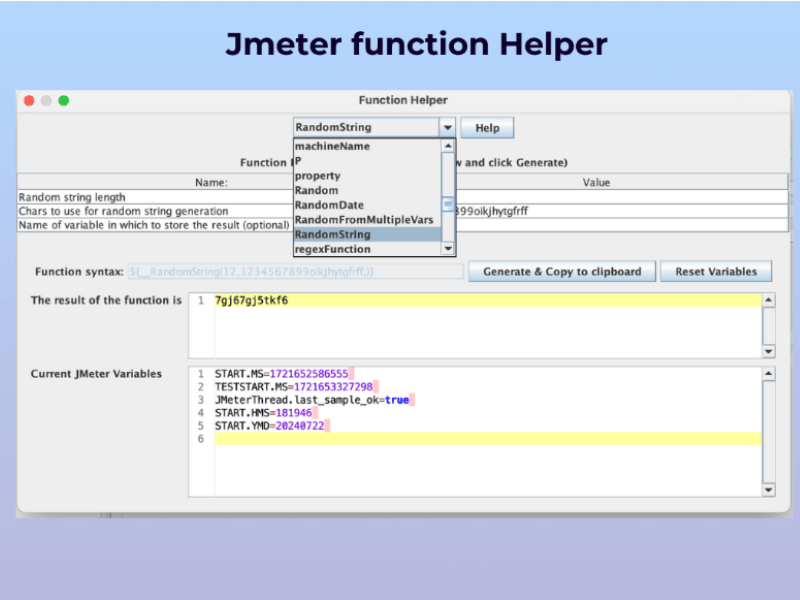
Deep dive into the JMeter Functions and Variables
Now that you know the key components, let’s dive a bit deeper into JMeter functions and variables. The two essential features that make your tests more dynamic, flexible, and reusable.
Functions in JMeter are dynamic values that change during test execution.
- They use a special syntax: ${__functionName(parameters)}.
- They are small, automated commands that perform actions like generating random numbers, fetching data, or creating timestamps.s.
Example:
- ${__time(YMDHMS)} → returns the current time in a set format.
- ${__Random(1,1000)} → generates a random number between 1 and 1000.
Why use functions?
They help you avoid hard-coding data. Instead of manually entering usernames, tokens, or IDs, functions can automatically generate or substitute those values during each test to run, making your scripts adaptive and realistic.
Variables are placeholders used to store and reuse data across multiple test elements.
- You can define them in your test plan, user-defined variables, or configuration elements.
- Syntax: ${variableName}.
Example:
- Define a variable baseURL = https://example.com
- Use ${baseURL} in all HTTP requests instead of typing the URL repeatedly.
How functions and variables work together:
A function can generate a value, and a variable can store it for reuse.
Example: ${__UUID()} generates a unique ID → store it in a variable session_id → use it in subsequent API requests for consistency.
Predefined JMeter variables make debugging easier and add context to tests:
- ${__samplerName} → name of the sampler currently executing
- ${__threadNum} → thread number
- ${__time} → current timestamp
In short:
Functions perform automated actions and generate values.
Variables store and reuse those values.
Together, they make your test scripts smarter, cleaner, and scalable, reducing repetitive work and enhancing flexibility in your performance testing.
How to Use JMeter for Performance Testing
Running a performance test in JMeter is like running a mini simulation of how real users interact with your application. Here’s how the process works in a few simple steps.
First, you begin by creating a Test Plan. This plan defines what you want to test, such as the number of virtual users, the requests they’ll send, and how long the test should run. It acts as your blueprint for the entire performance test.
Next, JMeter uses Thread Groups to generate virtual users and send multiple requests to the target server, mimicking real-world traffic. Each virtual user (or thread) follows the same sequence of steps you define, like logging in, browsing a product, or submitting a form.
As the test runs, the server processes these incoming requests and returns responses. JMeter collects all these responses in real time and begins analyzing important metrics such as response time, throughput, latency, and error percentage.
Once the test is complete, JMeter displays detailed visual reports and graphs that highlight performance trends and bottlenecks. You can instantly see which parts of your system slow down when traffic spikes or where errors start to appear under heavy load.
This process helps testers and developers answer critical performance questions:
- How many users can the system handle?
- Which requests are the slowest?
- At what point does performance begin to degrade?
By understanding these insights, QA teams can optimize configurations, fine-tune code, or scale infrastructure to ensure a faster and more stable user experience.
To get reliable results, start small. Begin with a low number of users and gradually increase the load to observe how your application behaves. Monitor system resources such as CPU, memory, and network usage while the test runs. Always use realistic data and think from the end-user’s perspective.
Combine JMeter test performance with analytics tools like BlazeMeter, Grafana, or InfluxDB to visualize trends more effectively. Keep your plugins up to date and maintain consistent naming conventions in your variables and functions; it’ll make debugging and reporting much easier.
If you’re new to the tool and want hands-on guidance, this beginner-friendly JMeter tutorial helps you get started with real examples and practical scenarios.
Conclusion
Performance issues can sneak up on any application, no matter how good your code is. That’s why tools like JMeter are such game-changers. It doesn’t just test how fast your app runs; it helps you understand why it performs the way it does.
Once you start exploring JMeter functions and variables, you realize how much power they add to your tests. You can make your scripts smarter, reuse data easily, and create test scenarios that reflect real user behavior, not just artificial numbers.
The best part? You don’t need to be a developer to get started. JMeter’s interface and automation features make it accessible for anyone who wants to make their application faster and more reliable.
So, if you’re serious about improving speed, stability, and user experience, JMeter deserves a place in your QA toolkit. It’s simple, flexible, and built to help your product perform at its best, no matter how much load it faces.
Key resources:
A JMeter Tutorial for Beginners to Start With
An Overall Guide for JMeter Plugin Manager Download and Installation
FAQs
1. What is JMeter used for?
JMeter is an open-source tool used for performance, load, and stress testing of web applications, APIs, and databases. It helps testers measure system behavior under different levels of traffic, identify performance bottlenecks, and ensure applications run smoothly under real-world conditions.
2. How can I use JMeter for load testing?
You can use JMeter for load testing by creating a Test Plan that simulates multiple virtual users by sending requests to your server. Each user represents real traffic, allowing you to analyze metrics like response time, throughput, and error rates. This helps determine how well your application handles high load.
3. Can you give some JMeter examples?
Some common JMeter examples include testing website login performance, API response validation, database query speed, and stress testing an e-commerce checkout flow. These examples help QA teams monitor how different parts of a system behave under pressure.
4. How do I download JMeter?
You can download JMeter from the official Apache JMeter website. It’s a Java-based tool, so make sure you have Java installed before running it. Simply unzip the downloaded folder and launch JMeter using the “jmeter.bat” (for Windows) or “jmeter.sh” (for macOS/Linux) file, no installation required.
5. Why is JMeter best for load testing?
JMeter for load testing stands out because it’s free, flexible, and supports multiple protocols like HTTP, HTTPS, SOAP, REST, and JDBC. It also provides real-time reporting and integration with CI/CD tools, making it ideal for continuous performance testing in modern development environments.